

How To Combine Multiple Dimensions Into One Dimension In Looker Studio

In this blog, we’ll talk about a common challenge in Looker Studio and how to solve it. Sometimes, in Looker Studio, you might find the need to merge multiple dimensions of a table into a single dimension. Think of it as combining different columns of a table into one cohesive table in Looker Studio.
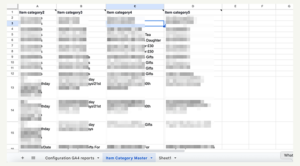
Let’s take a look at the table below. It has four columns or dimensions: item category 2, item category 3, item category 4, and item category 5. While each dimension has the same data type, they contain a mix of different and similar values.

Now, the goal is to merge all these dimensions into a single column without any repetition. It’s a common requirement, and we can easily achieve this using simple steps with the help of Google Sheets.
As we address this significant challenge, we’ll gain valuable insights that are in high demand when working with Looker Studio. Here’s what we’ll learn:
- 1. How to connect GA4 with Google Sheets.
- 2. How to combine multiple dimensions into one dimension.
- 3. How to connect Google Sheets with Looker Studio.
Let’s dive right in!
Step 1.
↓
Start with a blank Google Sheet.
↓
Click on ‘Extensions,’
↓
then select ‘Add-ons,’
↓
and finally, click on ‘Get Add-ons.

Step 2. A pop-up will appear. In the search box, type ‘GA4,’ and you’ll see suggestions. Choose ‘GA4 – Reporting for Google Analytics 4.’

On the next screen, choose ‘Adformatic’s GA4 – Reporting for Google Analytics 4.
Step 3. Install the add-on

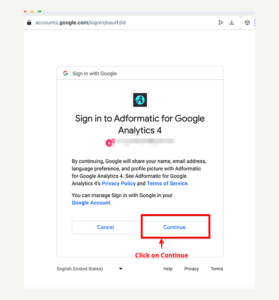
Step 4. It will prompt you to choose your email ID. Select the email associated with your GA4 property and then click on ‘Continue.

Step 5. Click the Allow button

Step 6. Click ‘Done’ and close the window
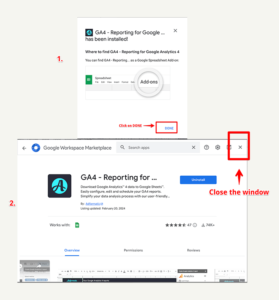
Step 7. The installation of the add-on is complete. You can locate your add-on under ‘Extensions.’ Simply click on ‘Extensions,’ and you’ll find your add-on listed there. In case you don’t see it immediately, give it a few minutes, then refresh the sheet.
Click on ‘Extensions,’ then select the recently installed add-on, which is GA4 – Reporting for Google Analytics 4. After that, click on ‘Create new report

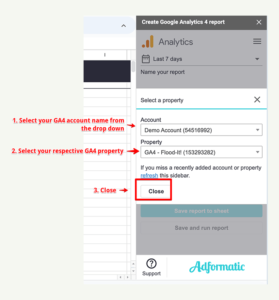
Step 8. You’ll notice a setup window on the right side of the sheet. In this window, you can choose the date range for your data and give a name to your data sheet.

Step 9. Choose your GA4 account, then pick the specific GA4 property where you want to merge data from
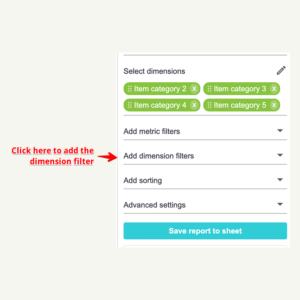
Step 10. In this step, we’ll choose the metrics or dimensions we want to combine. For this guide, we’re merging multiple item category dimensions into one. So, let’s select our dimensions from the dropdown menu


Step 11. If you’d like to add dimension filters, this step is for you. However, if not, feel free to skip it. In my report, I want to exclude ‘not set’ data, so I’ll create a filter to exclude it
Click on ‘Add dimension filters,’ choose ‘Exclude,’ then select your dimension. I’ll choose ‘Exact’ in my case, but you can select the comparison operator based on your needs. In the text box, add ‘(not set)’ in my case, or add the text that fits your requirements

Likewise, we can apply filters to other dimensions too
Step 12. After setting up the filters, we’re good to go. Click on the ‘Save and run the report’ button

Step 13. If the report is successful, you’ll see a pop-up with the status ‘Done.’ Simply close the pop-up

Step 14. Here, you can view all your GA4 data within the selected date range from Step 8. Feel free to remove any unnecessary data

After removing unnecessary data, my sheet looks like this:
Having successfully brought our data from GA4 to Google Sheets, our next move is to merge the data from four columns (item category 2, item category 3, item category 4, item category 5) into a single column, which we’ll name ‘item category,’ ensuring there’s no repetition of the same data
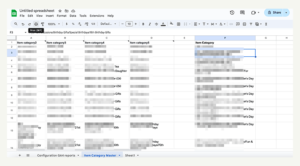
Step 15. Choose an empty column and label its header as ‘item category.’ Below the header, enter the following formula:
=UNIQUE({A2:A;B2:B;C2:C;D2:D})
Press Enter.
Here, the UNIQUE function gathers data from the specified columns (A, B, C, D), eliminates duplicates, and displays the result in my case, in column F (item category). You can select any other empty column, like column E, based on your preference.
In ‘A2:A,’ ‘A2’ denotes starting from cell 2 in column A, and ‘A’ signifies the entire data in column A. In my case, I’m combining data from four columns (A, B, C, D) and displaying it in the ‘item category’ column

After pressing Enter, you’ll witness the magic as all the data from the four columns is seamlessly combined into a single column
Congratulations! In just a few simple steps, you’ve learned two things:
- 1. How to connect your GA4 with a Google Sheet.
- 2. How to merge multiple columns with the same type of data into one column.
Now, the next step is to connect our Google Sheet with Looker Studio. Let’s do it ->
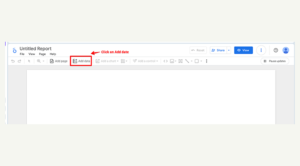
Step 16. I hope you know how to connect your Looker Studio with Google Sheet. If not, follow these simple steps:
- – Open your Looker Studio.
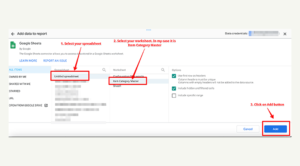
- – Click on ‘Add data‘
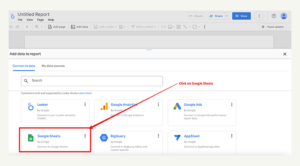
Choose Google Sheets as your data source
↓
1. Choose your spreadsheet
↓
2. Pick your worksheet
↓
3. And then click on the ‘Add’ button
↓
1. Now, click on ‘Add chart’
↓
2. Select the table
↓
3. And drag it into the work area

You’ll find your work area looking something like the example below. In the SETUP section, under Dimensions, if ‘Item Category’ is not already there, click on the dimension (in my case, I will click on ‘Item Category’)

Select item Category

Voila! You’re done, and now you’ll see all the data from different categories (item category 2, item category 3, item category 4, item category 5) in one dimension, named ‘Item Category.’

Congratulations! You’ve achieved it. In just a few easy steps, you’ve learned three things:
- 1. How to connect GA4 with Google Sheet.
- 2. How to merge multiple columns into one.
- 3. How to connect Google Sheet with Looker Studio.
I hope this guide proves helpful. If you have any questions, feel free to ask in the comment section.
If you prefer video guides, here it is: